Claude 为 Connector 开发者推出性能监控仪表盘
Claude给connector开发者加了仪表板,能跟踪用量和错误,还能直接提交到目录,做MCP集成的省了监控的麻烦,即开即用。
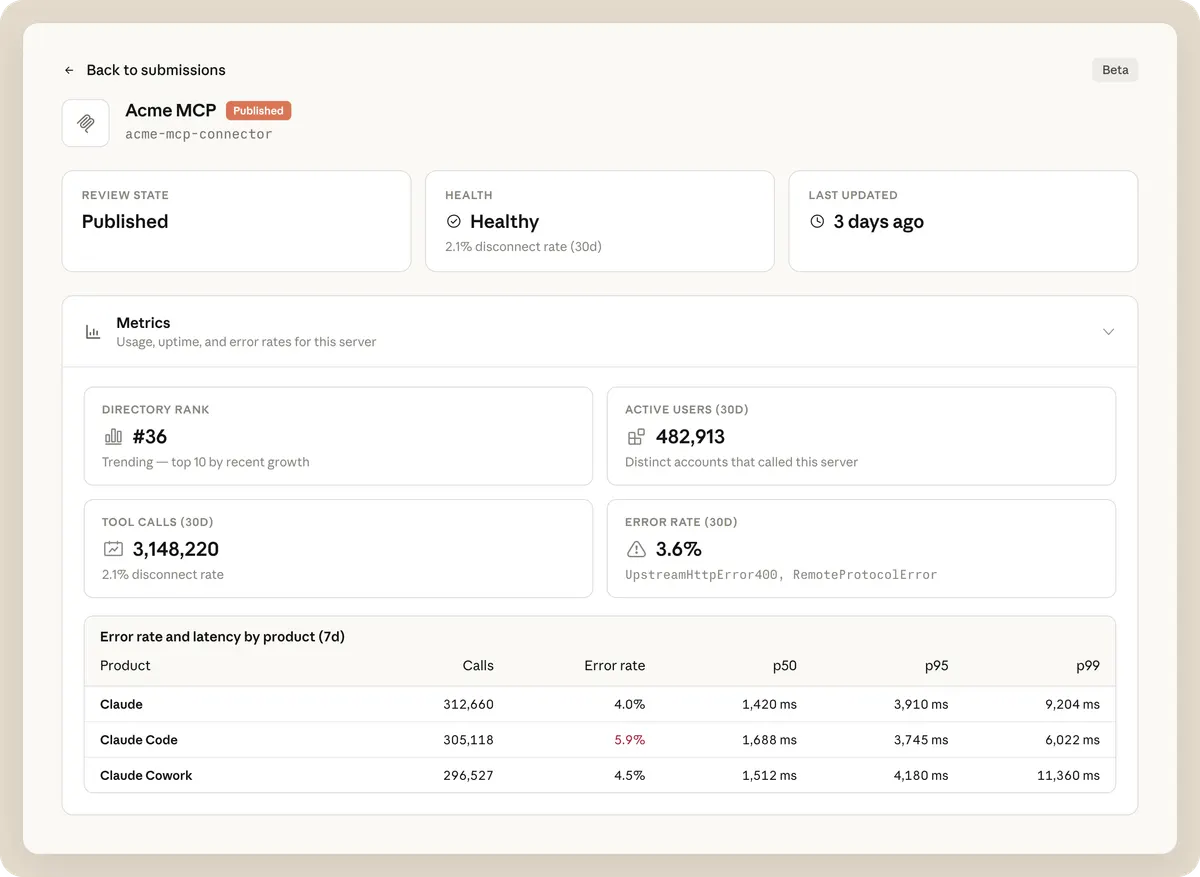
Claude 为目录中已发布的 Connector 新增性能监控仪表盘(公开测试版)。所有者可追踪活跃用户、工具调用次数、目录排名、健康评分、错误率、延迟,并按工具细分错误归因;还能按 Claude、Claude Code、Cowork 等产品分解使用情况。访问需 Team 或 Enterprise 账号(Admin/Owner 权限或自定义角色)。基于 MCP 构建的 Connector 可直接在 Claude 应用内提交至目录,该目录已有超 300 个第三方 Connector,每日被数百万人使用。

Observability for developers building connectors
Developers can now monitor their connectors' performance across Claude products and submit connectors to the directory in-app.
- Category
- ProductClaude apps
- DateJune 8, 2026
- Reading time5min
- https://claude.com/blog/observability-for-developers-building-connectors
Monitor, debug, and improve connectors
Published connectors in the directory now have a dashboard showing how they’re performing across Claude product surfaces. Connector owners can use it to:
- Track adoption. Monitor active users, total tool calls, and directory rank over time.
- Diagnose errors and latency. See health score, error rates, and latency at a glance, with per-tool error breakdowns to pinpoint what's failing.
- Break down usage by product. Compare tool calls across Claude, Claude Code, Cowork, and more to understand where users are engaging.
Available today in public beta. Find it in Claude under Directory in Organization settings. Requires Admin or Owner access on a Team or Enterprise plan. On Enterprise, Owners can also delegate access with a custom role that has the Directory management or Libraries permission.
Joining the directory
Connectors are built on the Model Context Protocol (MCP). There are over 300 third-party connectors in the directory, used by millions of people every day. If you wish to submit your MCP server to the directory, you can now do so directly in Claude.Learn more.
FAQ
Transform how your organization operates with Claude
Get the developer newsletter
Product updates, how-tos, community spotlights, and more. Delivered monthly to your inbox.